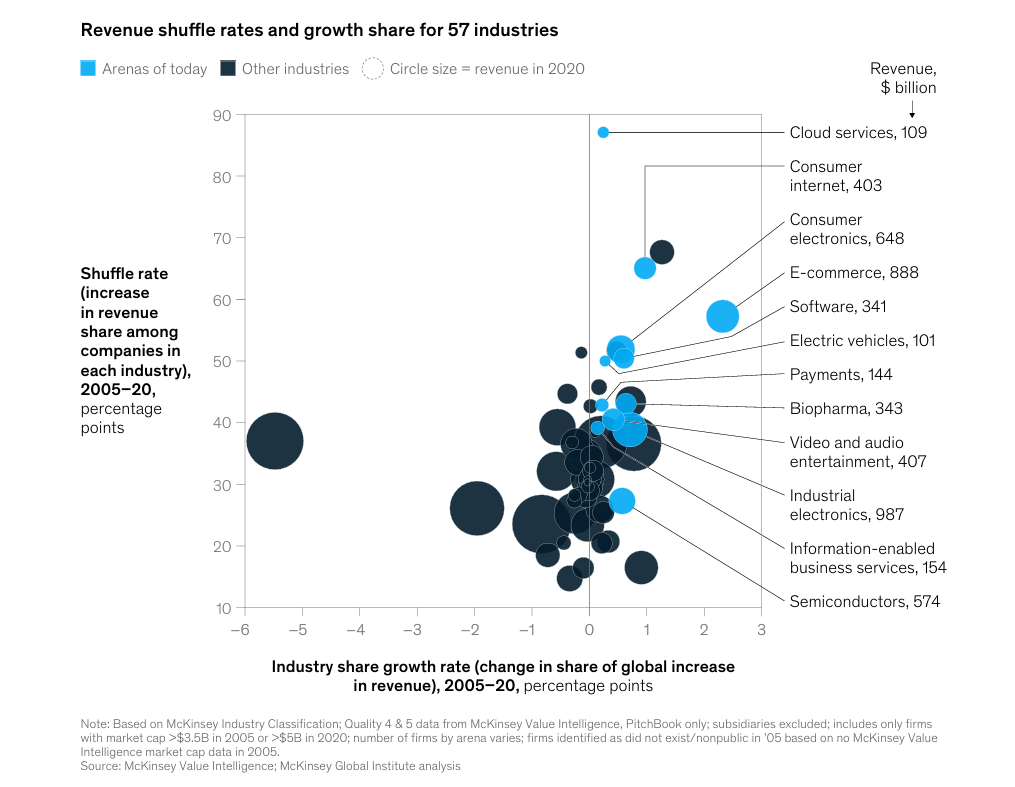
According to the McKinsey report, there are 12 areas of competition that are growing rapidly and dynamically. To identify these areas of competition, McKinsey used market research to produce a set of data covering the world's 3,000 largest companies. In the course of the analysis, McKinsey reclassified some companies or their businesses from broad industry categories (e.g., retail) to more specific competitive categories (e.g., e-commerce). In some cases, this means splitting a large company, such as Microsoft or Amazon, into two or three parts and grouping them into different competitive categories.
Industries with rapid growth and outstanding market dynamism are then screened out. Specifically, these industries expanded rapidly between 2005 and 2020, growing much faster than overall economic growth, resulting in a significant increase in their share of global revenue and market capitalization in 2020 compared to 2005. We refer to this difference as the "industry share growth rate" and it reflects the excess value created by these sectors. In addition, we measure the extent to which firms' market share changes within the industry – a metric known as the shuffle rate. In other words, McKinsey has chosen to compete in areas that have a higher market share mobility within their industries than other industries.
According to the market share change examined by McKinsey, that is, how much revenue or market capitalization has shifted between companies. For example, in the mobile and consumer electronics industries, in 2005, Sony's revenue market share in this area was 27%, but by 2020 it had fallen to 13%, a decrease of 14 percentage points. Apple's market share in 2005 was only 4%, and by 2020 it had increased to 30%, an increase of 26 percentage points. Using this method, McKinsey calculates the change in market share of all companies in the market and adds up the percentage points of all positive changes to arrive at the industry's revenue-based "market shuffle rate," or 53 percentage points.
By comparing the market share changes of the aerospace and defense industry with a comparison of low-activity industries, the market vitality of the industry is significantly lower. Using the same analytical methodology, the industry's "market shuffle rate" is only 16 percentage points, which is much lower than the reshuffle rate of the mobile and consumer electronics industries. This indicator reflects the level of dynamism within the industry.
McKinsey hypothesizes that if an industry has not yet formed a revenue or market capitalization at the beginning of a period, its overall market share will inevitably undergo a 100% shift, and the emerging electric vehicle industry is a typical case. Since industry dynamism is a key criterion for being selected as a competitive field, any emerging industry meets this criterion and is included in the analysis.

Figure: Today's 12 competitive areas have a high reshuffle rate
Rapid growth in the competitive field and changes in industry share
Compared to other industries, McKinsey notes that the competitive areas it defines showed significant growth between 2005 and 2020. Its revenue is growing at an average annual rate of 10%, much higher than the 4% in other industries. Overall, the share of revenue in these 12 competitive areas jumped from 6% in 2005 to 14% in 2020, while their market capitalization almost tripled from 12% to 34%.
The biggest changes in industry share are mostly concentrated in areas driven by new tech giants, such as cloud services, consumer-grade internet, and e-commerce. These growth are driven by leading technology companies such as Alphabet (Google), Amazon, Meta (Facebook), and Microsoft. For example, the e-commerce industry saw the highest growth in both revenue and market capitalization:
- In 2005, the total revenue of the e-commerce industry was only $15 billion, accounting for 0.1% of the total revenue of all industries. By 2020, that number had soared to $890 billion, or 2.4 percent.
- In 2005, the total market capitalization of the sector was US$87 billion, accounting for 0.35% of the market capitalization of all sectors. By 2020, its market capitalization had grown to $3.3 trillion, accounting for 4.2%.
- Alibaba, Amazon, and JD.com contributed $547 billion in revenue growth, accounting for 63% of the industry's total growth; At the same time, these three companies also contributed $2.1 trillion in market capitalization growth, accounting for 64%.
Similarly, the total market capitalization of the consumer Internet industry in 2005 was $215 billion, accounting for 0.87% of the market value of all industries; By 2020, this figure had grown to $3.5 trillion, accounting for 4.4%. In this space, Alphabet, Meta and Tencent are the main players.
The cloud services industry has also shown phenomenal growth: in 2005, the total market capitalization of the industry was only $54 billion, accounting for 0.2% of the overall market. But by 2020, that number had climbed to $1 trillion, or 1.3 percent. This growth was primarily driven by Amazon's AWS and Microsoft cloud services businesses.
Related:
18 Potential Arenas of the Future That Could Reshape the Global Economy (1)
18 Potential Arenas of the Future That Could Reshape the Global Economy (2)
18 Potential Arenas of the Future That Could Reshape the Global Economy (3)


