
Charging operation: The number of new energy vehicles and the charge capacity of bicycles are increasing, and the market space is vast.
Charging operation service providers are in the middle and lower reaches of the charging pile industry chain. The charging pile industry chain mainly includes:
Upstream: Mainly suppliers of components for charging pile equipment, including charging modules, power devices, contactors, transformers, connectors, etc. Representative companies include Xuji Electric, KSHIDA, Incore, and Wall Nuclear Materials.
Midstream: Charging pile manufacturers and operators have overlapping businesses. Many mainstream charging pile companies adopt the "production + operation" integrated model. Representative companies include Shenghong Co., Ltd., Green Energy Huichong, China Southern Power Grid, Xingxing Charging, Te Laidian, Bull Group etc.
Downstream: The downstream of charging piles is mainly dominated by new energy electric vehicles and charging service operation solutions. Representative companies include BYD, Tesla, Dongfang Electronics, Schneider Electric, etc.
The number of charging piles continues to increase, and the ratio of vehicles to piles gradually decreases
As the supporting infrastructure for new energy vehicles, the number of charging piles continues to increase with the increase in the number of new energy vehicles. The vehicle-pile ratio refers to the ratio of the number of new energy vehicles to the number of charging piles. It is an indicator of whether charging piles can meet the charging needs of new energy vehicles. The lower the vehicle-to-pile ratio, the more sufficient the supply of charging piles is and the more convenient it is to charge new energy vehicles. By the end of 2022, the number of new energy vehicles in my country has reached 13.1 million, and the number of charging piles has reached 5.21 million. The vehicle-to-pile ratio is 2.5, which has dropped significantly from 11.6 in 2015.

Number of new energy vehicles in China (10,000 units), number of charging piles (10,000 units), and vehicle-to-pile ratio (right axis) from 2015 to 2022
The increase in the number of new energy vehicles and the electric charge of bicycles will bring about an increase in the scale of the charging operation service market.
According to GGII data, my country's new energy passenger vehicle single battery installed capacity from 2020 to 2022 was 46.1/47.3/51.4kWh respectively, a significant increase, mainly driven by the demand for long battery life. At present, the main income of charging operators comes from charging electricity fees and service fees, both of which are directly proportional to the charging capacity. Therefore, with the gradual increase in the number of new energy vehicles and the electric charge of bicycles, the revenue scale of charging transportation services is expected to increase significantly. increase.
Profit model: Currently, electricity and service fees are mainly collected, and the time utilization rate of charging piles is the core of profit.
The charging pricing formula is "electricity price = electricity fee + service fee", and the charging standards of different operators are different.
Single pile initial investment calculation
According to calculations, the initial investment cost of a single 50kW DC charging pile is about 57,000-60,000 yuan, corresponding to an initial investment of about 1.14-1.2 yuan/W. The specific calculation is as follows:
- Equipment investment: The cost of DC pile charging equipment (including monitoring system) is about 5 yuan/W. Therefore, the equipment investment for a single 50kW DC pile is about 25,000 yuan.
- Civil engineering and construction investment: including plane layout, cable and wire procurement and assembly, ceiling assembly, etc. The diluted cost of a single pile is about 10,000 to 13,000 yuan.
- Distribution side equipment costs: including relay protection, low-voltage electrical appliances, electricity meters and other equipment, the diluted cost of a single pile is about 20,000 yuan.
Single pile cost calculation
It is estimated that the fixed cost of a single 50kW DC charging pile is about 13,800 yuan. The specific calculation is as follows:
- Interest expense: Assuming that the loan ratio is 50% and the loan interest rate is 6%, the annual interest expense is approximately 1,800 yuan.
- Depreciation expense: Assuming that the depreciation period is 10 years, the average annual depreciation expense is approximately 6,000 yuan.
- Equipment maintenance + labor costs: Assuming it is 10% of the initial investment, it is estimated to be about 6,000 yuan.
The variable cost of a single charging pile generally includes two parts:
- Electricity charges: Considering that consumers are sensitive to electricity prices, charging operators usually charge electricity charges based on a parity policy, which means they are consistent with grid charges and do not engage in price difference arbitrage. In order to simplify the model, this part is not considered.
- Parking lot service fee sharing/operation and maintenance costs, etc.: Some parking lots require a certain proportion of charging service fees and other later operation and maintenance costs, etc. It is assumed that this part of the cost is 10% of the service fee.

Calculation of single pile income, profit, and investment payback period
It is estimated that the average annual income of a single 50kW DC charging pile is about 17,500 yuan, the average annual profit is about 2,000 yuan, the annual net cash flow is about 8,000 yuan, and the static investment payback period is about 8 years. The specific assumptions are as follows:
- Single pile utilization efficiency: Assume that the single pile utilization efficiency is 8%.
- Service fee income standards: Refer to the service fee collection standards of various provinces and cities above, assuming it is 5 yuan/kWh.
- Average annual variable cost per pile: Assumed to be 10% of the service fee.
Improving the utilization efficiency of a single pile is a core factor in increasing the profits of charging piles and shortening the investment payback period. Based on the above calculation process, a sensitivity analysis was conducted on the utilization efficiency of a single charging pile and the electricity service fee. The results are as follows:
- Impact on the profit of a single pile: Assuming that the electricity service fee remains unchanged at 5 yuan/kWh, when the utilization efficiency of a single pile increases from 6% to 10%, the profit of a single pile increases from -2,000 yuan to 5,900 yuan; average For every 1% improvement in single pile efficiency, profit will increase by RMB 2,000.
- Impact on investment payback period: Assuming that the service fee for electricity remains unchanged at 5 yuan/kWh, when the utilization efficiency of a single pile increases from 6% to 10%, the investment payback period drops from 15 years to 5 years, which is significantly shorter than the useful life of the equipment (about 10 years).
Barriers to competition: Capital, site, power grid capacity, and data resources create barriers. Leading operators have significant advantages.
There are four main barriers in the charging operation industry: capital, physical space, power grid capacity, and data resources. Leading companies have significant first-mover advantages and scale advantages, and are difficult to catch up with new entrants. They are expected to maintain their leading edge in industry competition.
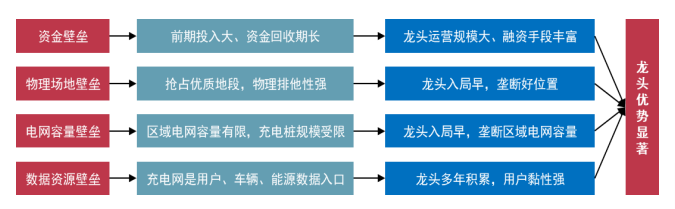
The first-mover advantage of leading companies from the perspective of four major competition barriers in charging operations
1. Capital barriers: large capital investment in the early stage of charging operation and long recovery cycle
Charging station operation is an asset-heavy operation industry and requires a large amount of capital investment in the early stage. According to the calculations in the article "Profit Model and Economic Benefit Analysis of Electric Vehicle Charging Facilities", under four charging station scenarios (small-bus, large-bus) , small-passenger, large-passenger), the initial investment costs are all in the million yuan level. Looking at the average unit investment level, the investment scale for 1kW power is between 3,000-5,000 yuan. Taking large-scale passenger car charging stations as an example, investment in charging equipment accounts for about 30%, investment in distribution network equipment accounts for 27%, construction and installation fees account for 36%, and other expenses account for 7%. According to calculations, under the conditions that the electricity service fee remains 0.5 yuan/kWh and the charging time utilization rate is 8%-10%, the investment recovery period of charging piles is 5-8 years.
Leading operators have smooth financing channels and have financial advantages
Take the leading companies of charging operators Telaidian and Xingxing Charging as examples. Among them: Tilaidian's parent company Terud is a listed company with abundant financing methods. Since 2014, the company has successively purchased assets and convertible bonds through private placement and issuance of shares. Raise funds through other methods, and at the same time gradually introduce external strategic investors to increase capital in Te Laidian. Star Charging is an unlisted company. It completed Series A financing in 2020 with a financing amount of 855 million yuan. It completed Series B financing in 2021, led by Hillhouse Capital, with a post-investment valuation of 15.5 billion yuan. In the charging operation industry with large initial capital investment and long investment recovery period, leading operators with larger charging assets have more abundant financing methods and more common financing channels, and have a financial advantage over small and medium-sized operators.

2. Physical site barriers: Naturally possessing strong exclusivity, the density of urban public piles has been limited.
The construction of charging piles naturally has strong exclusivity properties. Once an operator builds charging piles in a specific physical site, its competitors will not be able to install other charging piles in the same area. Considering that the service life of charging piles is generally 5-10 years, the exclusivity of the physical location of charging piles lasts longer. Considering that operators adopt the method of leasing venues, even if the lease expires, with years of cooperation experience and customer service stickiness, it is expected that the original operator will be more likely to renew the contract.
In the stage of rapid development of charging piles, as the scale of charging piles in most cities gradually increases, urban space has entered a relatively stable stage of stock development. According to data from the "Charging Infrastructure Monitoring Report in Major Cities in China 2022" released by the China Urban Planning and Design Institute, there is currently no obvious negative correlation between the city's public vehicle pile ratio and the density of public charging piles. More than half of the cities The ratio of vehicles to public piles should be within 6 and the density of public piles should not exceed 20 units/square kilometer. This shows that even if the vehicle-to-pile ratio decreases, the number of charging piles available for construction in a certain area is limited, and the density of public piles is difficult to increase, reflecting the strong site barrier properties of charging pile construction.
Currently, the average coverage rate of public piles in central urban areas exceeds 70% and in the largest cities exceeds 90%. The area where charging piles can be "circulated" is limited. In the "2022 Charging Infrastructure Monitoring Report for Major Cities in China", the "public pile coverage rate" indicator is used to measure the service capacity of public piles in central urban areas. The specific calculation method is: the construction land area covered by a 900-meter radius of public piles and the total construction land area ratio. According to statistics from the China Urban Planning and Design Institute's "Charging Infrastructure Monitoring Report for Major Cities in China 2022", as of the end of 2021, the average coverage rate of public piles in the central urban areas of 32 sample cities was 73.3%, including megacities such as Shanghai and Shenzhen. The coverage rate of public piles exceeds 90%. The larger the city, the higher the coverage rate of public piles in the central urban area. Therefore, for new entrants, especially in central urban areas of large cities, the coverage of charging pile construction is limited.

Comparison of public pile coverage rates in central urban areas of cities of different sizes
3. Grid capacity barrier: Considering the grid capacity, the construction and operation scale of charging stations is limited.
For the distribution network, the maximum load of the charging station is determined by the charging power of the charging station and the number of charging piles. With the substantial increase in the number of charging piles and charging power, the impact of electric vehicle charging on the grid capacity cannot be ignored. The main impact of charging piles on the distribution network:
- Increase the gap between load peaks and valleys, resulting in overloading of lines and transformer loads
The charging behavior of electric vehicles usually highly coincides with the daily load curve of residents, which will cause peaks to peak and lead to a widening gap between peaks and valleys. Load peaks will seriously affect the safety and stability of the power supply, requiring improvements to lines and transformers, and the grid will have to spend extra costs to lay new feeders and purchase transformers. Due to the huge peak-to-valley difference, short peak load time and high amplitude, the idle cost of distribution network resources is high and the equipment utilization rate is low.
- Voltage offset and voltage limit violation
Due to load changes in the power supply system, the voltage of each node in the system will change accordingly, deviating from the rated value of the system voltage, that is, voltage offset, which will affect the quality of power. Since the instantaneous power of charging piles is very large, it is easy to cause the voltage offset to increase, even exceeding the specified limit, that is, voltage over-limit, which seriously affects the safety of the distribution network.
Considering the impact on power grid capacity, there is an upper limit on the number and power of charging pile construction and operation in a certain area. At the same time, power grid expansion requires increased investment and approval and design planning from relevant government departments. Therefore, early entrants in the industry often have a strong monopoly on power grid capacity.
4. Data resource barriers: The charging network is the data portal for users, vehicles, and energy. Those who deploy it first will get richer data resources.
The charging network is a typical distributed, digital industrial interconnection application that realizes real-time online, high-viscosity, and high-intensity interaction between users, vehicles, and energy sources, forming a massive amount of user behavior big data and industrial big data based on users, vehicles, and batteries. and energy big data. The operator's collection, analysis, processing and value mining of these data can comprehensively enhance the data value and intelligence level of the charging network. On the one hand, it can increase the operator's profits. On the other hand, it can continuously improve the user experience and further enhance the user experience. Stickiness, forming effective positive feedback.
Leading operators hold data resource value options and are expected to lead innovation in profit models
Relying on the massive number of active users on the platform, the new profit models currently developed by leading operators include:
- Parking space management: Security maintenance and charging piles are equipped with cameras, motion sensors and other equipment to expand the depth of services and increase safety. At the same time, each parking lot is charged one at a time, reducing the pressure on the toll booth at the entrance of the parking lot.
- "Charging pile + advertising": Let charging piles become new carriers of advertising, with print media advertising on charging piles and LCD screens or advertising light boxes installed on charging piles.
- APP traffic monetization: Mobile APP can obtain a group of high-quality customer information, push customized advertising content and related services by counting charging time and calculating clean travel distance, such as pushing food and entertainment scenes near charging stations.
- One-stop service: Provide one-stop services such as unmanned meals, rest, convenience stores, and vehicle maintenance near charging stations to open up new consumption scenarios and profit opportunities. Leading operators entered the market earlier. After years of charging network operation platform construction and APP operation, they have a large number of highly sticky customers and charging data resources. They are expected to be the first to benefit from profit model innovation through their scale advantages.

Fast Electric Preferred Charging Station provides one-stop charging service
Industry structure: three types of participants, significant Matthew effect
Historical review of the charging pile industry:
- Starting period (before 2014): China's new energy vehicle industry has just started. At that time, charging piles were mainly built by "national teams" such as State Grid and China Southern Power Grid.
- Rough development period (2015-2017): On November 18, 2014, four ministries and commissions including the Ministry of Finance and the Ministry of Industry and Information Technology jointly issued the "Notice on Rewards for the Construction of New Energy Vehicle Charging Facilities", which for the first time combined the number of new energy vehicles promoted with charging facility subsidies. Rewards are linked and private capital is allowed to enter the charging pile industry. From 2015 to 2017, the construction speed of charging piles accelerated, and the annual growth rate of the number of new charging piles was 1250%/270%/200% respectively.
- Shuffle period (2018-2020): After the early "horse race"-style development, the unreasonable layout of some charging piles led to low utilization efficiency and resulting in profit losses. Some companies with insufficient technical and operational capabilities were the first to be eliminated. The development of the industry The cooling coupled with the reduction of subsidies for new energy vehicles from 2017 to 2020 will slow down the pace of charging pile construction.
- A new era of development (after 2021): In the 2020 Government Work Report, charging piles were included in the "new infrastructure" and became one of the seven major industries. At the same time, as the penetration rate of new energy vehicles accelerates, charging piles usher in new rapid development stage.

Charging operators mainly have three types of participants: asset-based, third-party and car companies. China's public charging operation service providers can be mainly divided into three categories: First, asset-based operators represented by Telaidian and Xingxing Charging, which focus on the operation of their own assets and cooperate with other operators and third-party platforms to Achieve complementary traffic on the user side. The second is third-party charging service providers represented by Nenglian Smart Electric and Kuaidian, which connect users and asset-based charging operators through third-party charging networks; the third is car company charging operators represented by Tesla and NIO. , providing public charging services to self-owned car owners.
The Matthew effect in the industry is significant, and the position of the leading operators is difficult to shake. In terms of total volume, based on the statistics of the China Charging Alliance, the Matthew effect in the domestic public charging operator industry is significant, showing a highly concentrated state. From 2019 to February 2023, the industry CR5 was 81.5%/83.9%/77.8%/69.8%/70.2%, and the CR10 was 93.3%/92.7%/89.2%/86.3%/86.6%. Operators such as Teladian, Xingxing Charging, Yunkuai Charging, and State Grid ranked high in the market share of charging pile operations. The leading Teladian and Xingxing Charging have a market share of about 20%, and their position remains stable. The concentration tends to be stable and concentrated, and the position of the leading operators is difficult to shake.
Te Laidian ranks first in the industry in the fields of dedicated DC piles, total power and charging capacity, and has a significant market share lead. According to different service objects, public charging piles can be divided into public and special charging piles, and according to different charging power, they can be divided into DC and AC charging piles. In some segmented scenarios, the charging operation industry is more concentrated. According to data from the China Charging Alliance, such as statistics based on dedicated charging piles, DC piles, charging power, etc., the CR5 of the industry in March 2023 exceeded 80%. Among them, Telaidian ranks first in the fields of dedicated charging piles, DC charging piles, total charging power and charging capacity, with market shares of 38.9%, 28.3%, 23.0% and 25.0% respectively, surpassing the second place by 19.8pcts respectively. , 13.1pcts, 6.5pcts, 1.5pcts.